
Tharstern Desktop Features
Business Intelligence with Power BI
Self-service data analytics for business leaders
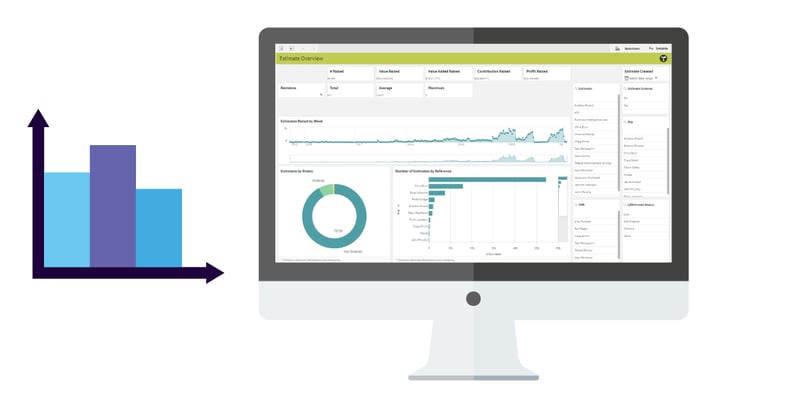
Data Analysis Made Easy with Microsoft Power BI Integration
Using our integration with Microsoft Power BI you can analyze the data in your MIS to identify trends and actionable insights and use data visualizations to make these findings easier to understand and share.
Using a clean and intuitive drag-and-drop interface, users can investigate information relationships and trends previously only possible by expensive and time-consuming database queries and analysis.
Allows users without specialist database or development skills to create and share spectacular infographics and charts based on information directly from their MIS.
Speak to an expert
Ask us about our integration with Power BI.
Key Features
Sample apps and dashboards
Created by Tharstern with the help of our customers, the standard dashboards demonstrate the power of the Business Intelligence features whilst providing key analytics required by most companies.
Self-service reporting
There's no need for high-cost development, coding or specialist report writing. Simple to use drag and drop interface enables the creation of powerful 'I’ll know it when I see it' solutions by almost anyone.
Flexibility and responsiveness
Work with our provided visuals and alter to your needs, or start from scratch. Create simple charts or highly complex illustrations that instantly respond to changes in context.
Smart search
Search the vast number of dimensions, measures, and metrics in your data set to find the one you require in seconds using simple, natural grammar.
Want to see it in action?
