In my previous article in this series where I spoke about calculations you’ll need for the value-based pricing approach, I ended on a comment about analyzing your different products and sectors, so you can plot them on a BCG matrix to see which ones are providing you with the most value. Here’s how you do that…
Using the method described in the previous article you will need to calculate the different performance ratios for all of the jobs you have produced grouped by, Product Type, Market Sector and then Product Type/Market Sector.
How to use the BCG matrix for your analysis
You can then plot these values on a chart like the one below. Here we see VA wages ratio plotted against VA Sales % for all of our different Product Type/Market Sector combinations.
Using the base ratios you calculated earlier, we can split the chart into four quadrants.
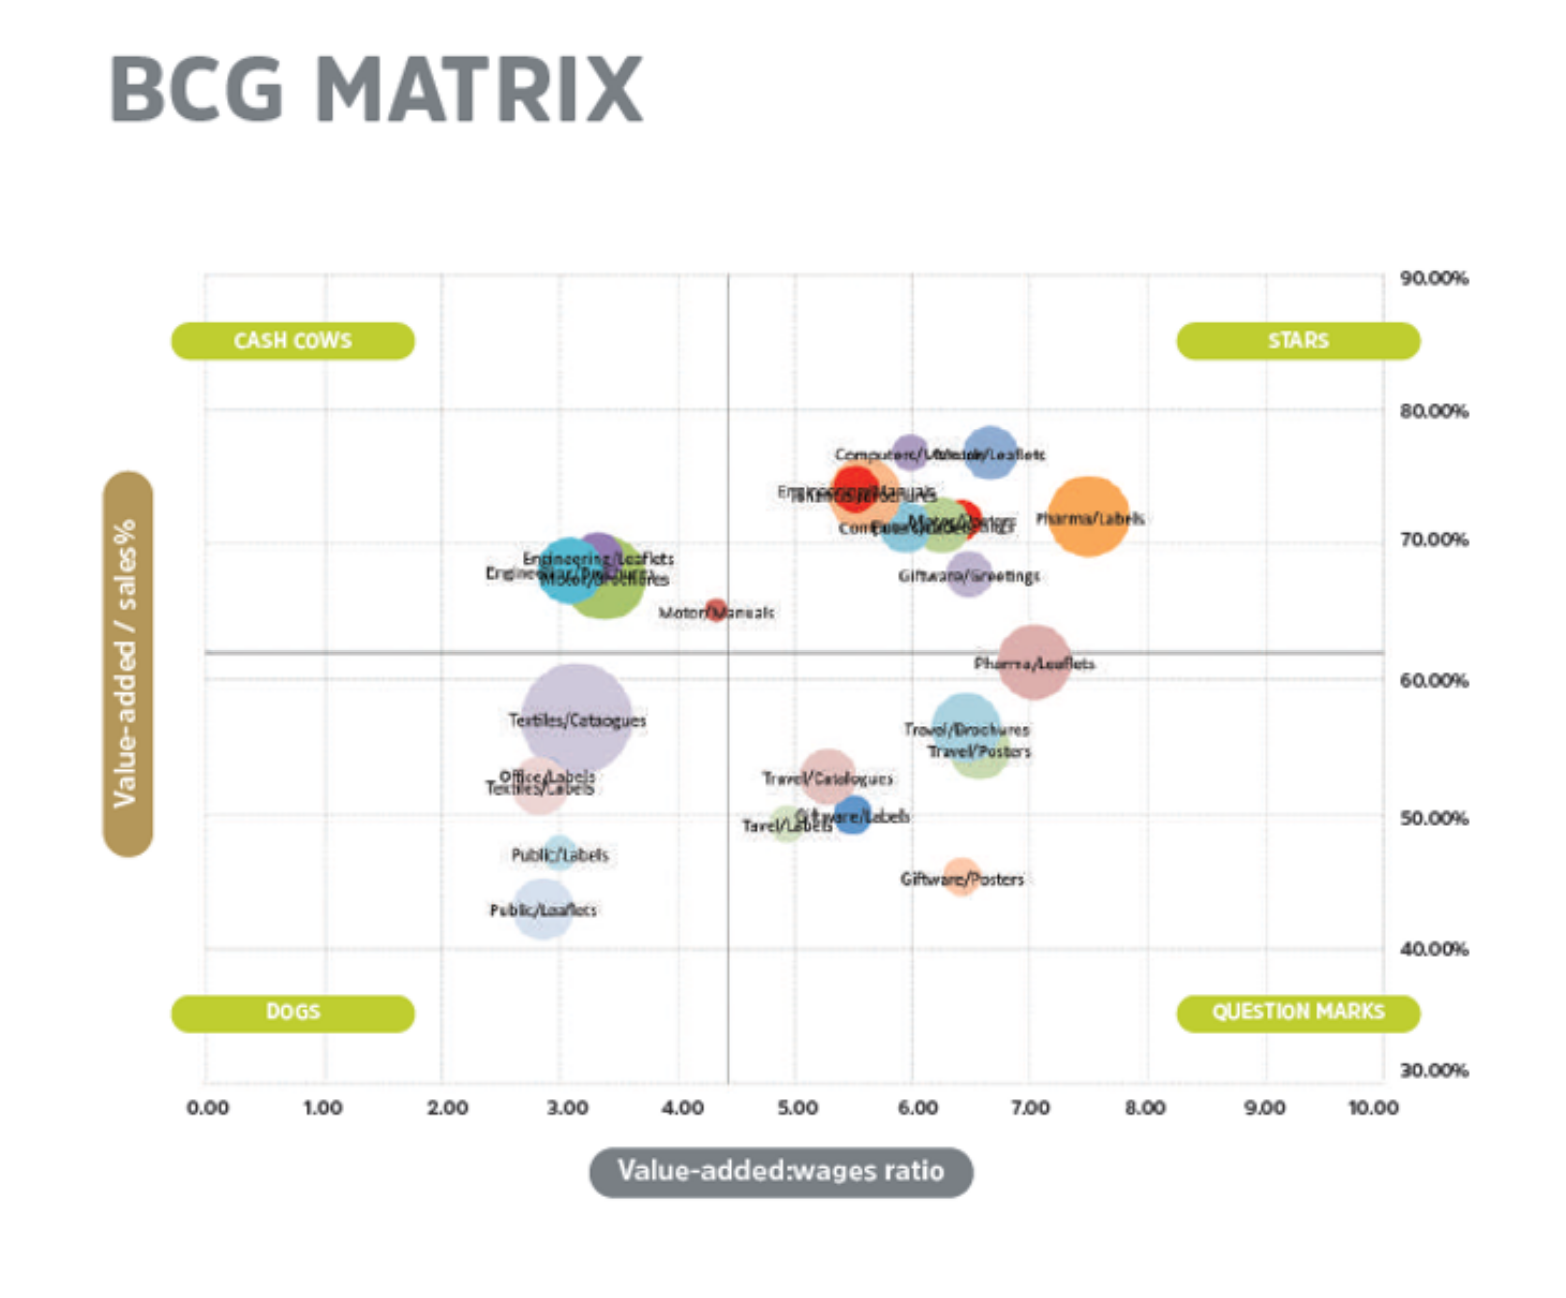
The four quadrants you have created are as follows:
Stars
Your Star products have a good VA contribution and are efficient to produce. So these product/markets are ones you definitely want to go after with everything you have!
Cash cows
Cash cows have a good VA contribution but are less efficient to produce. Take action to improve the efficiency in how the business produces these products. Maybe there is a justification to invest in new equipment or systems?
Question Marks
Questions Marks have a low VA contribution, but they are efficient to produce. Maybe there is an opportunity to develop in house production facilities in order to increase VA.
Dogs
Dogs have low VA and are less efficient to produce. If you can’t work out a way to manufacture them more efficiently AND increase retained VA, you should look to substitute these if possible.
In the example above, we plotted Product Type/Market Sector, but you can also plot Product Type on its own, or indeed combined with any other relevant metric for your organization.
Knowing your Stars, Cash Cows, Question Marks and Dogs, can provide valuable sales and marketing strategy information.
Back to pricing
We can also use this performance ratio analysis to assist us when calculating a price.
Remembering the Primark v Gucci handbag example I mentioned in the first article? We know that different sectors place a different value on the same product and we also know that different products attract a different perception of value.
Using the analysis you’ve carried out, you can substitute the performance ratio values into the formulas shown in the previous article to arrive at a price.
For example: Brochures in the education sector might have the following performance ratios:
VA/S% 56.4%, VA:W 6.46, C/S% 47.6%
Whereas the same product being sold to the IT sector might have:
VA/S% 72%, VA:W 7.5, C/S% 62.4%
If we use our materials price method applied to the example we looked at earlier, i.e.
- Materials: £3000
- Outwork: £525
- Wages (160hrs @ £20/hr): £3200
We’d arrive at two different prices:
- Brochures / Education: £3,525 / (1-56.4%) = £8,085
- Brochures / IT: £3,525 / (1-72%) = £12,589
Using a cost plus method as a means of arriving at a price may have either lost us the opportunity of winning the business through being too expensive relative to the customer’s value perception, or lost us the opportunity of the increased VA where the customer has a higher perceived value in the product you're selling.
How do I get hold of this information?
You most likely have all the information you need in your software systems right now. You need Sales, Purchases and Wages information, all of which is at the cornerstone of every MIS and will provide you with really powerful information.
You’ll also need to tag each job with a Sector and Product type – if you haven’t, it’s worth taking the time to add this information retrospectively and if you can’t do that, start recording it going forward so you can create this matrix in the future!
If you’re a Tharstern customer, we can help you extract this data from your MIS, so just get in touch with your account manager to arrange. If not, then we always suggest speaking to your MIS provider about accessing this information.
Final Words
I absolutely believe that one thing you should be doing (if you’re not already) is measuring your value-added performance ratio. As my mentor told me many years ago, “If you can’t measure it, you can’t manage it.” If you’re capturing that information, you can then analyze it to help you understand where to direct your efforts and it will really help you make key decisions for your business. As we’ve all experienced in recent times, having the right information to enable you to quickly pivot your strategies and target the right products and markets is critical.
Share this
Using Trello to plan and track jobs instead of a scheduling board

How to calculate a value-based price for printed products & services